June 20, 2023

Keep brands weird: The research framework for divergent content

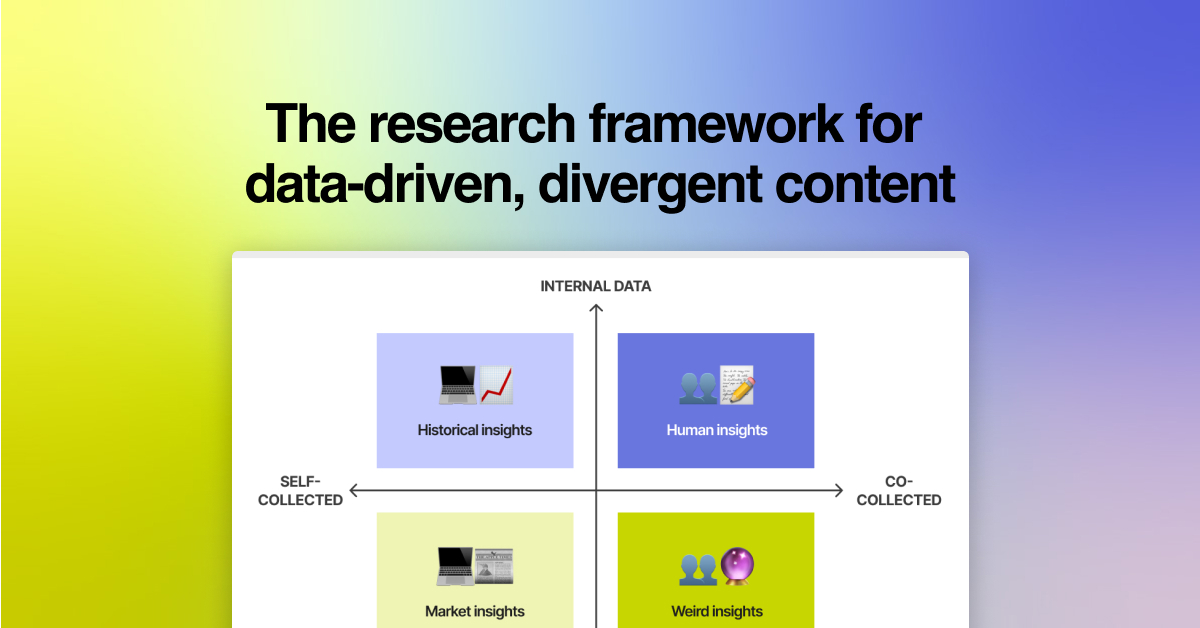
Originally published on The Content Technologist on June 1, 2023, as “Keep brands weird: The research framework for exceptional data-driven content.”

Content strategy is a dance. It takes artful maneuvering to charm humans with poetry, appease algorithms with keywords, and win revenue with strategic budgeting. But you can't stun the audience if you're using the same moves as everyone else. 

With algorithms homogenizing our feeds, it takes extra effort to look outside the usual places for inspiration. The good news: your competitors are as uninspiring as ever. The bad news: you run this risk as well if you’re feeding yourself the same inputs—using the same public AI platforms, drinking data from the same APIs, or reading the same newsletters and trend reports as everyone else. 

These sources can provide utility, but creating content with an edge requires diversifying your inputs. Your brand won’t stand out unless you search deeper and farther than everyone else. Unless you build your own ethnographic toolbox and travel to unexplored internet highways and data troves, you're going to have a hard time making something new.

As Landor & Fitch Executive Director of Insights & Analytics, Americas Maarten Lagae advises, don’t rely on convenient data for strategic decisions:

"If you’re planning to manage a brand by simply looking at social media data, you might as well drive your car on the highway just using a flashlight…It requires more rigor, time and resources to find multi-faceted answers and develop solid business cases that unlock budgets, board approval and ultimately business growth."

Not every content professional has a research team feeding into their work. If you need to seek out project insights yourself, this content research framework will help you find the right data—not just convenient data—for content strategy that makes a difference.


I also presented this at The Content Technologist's NYC community gathering in June 2023. Click here for my Figma deck, speaker notes, and one content joke.

content-research-fraamework

Today, you'll learn:

  • How to diversify your inputs and do better work in an era of homogenization
  • How to source the right data and maximize insight
  • How to use the content research framework — with examples of using mixed methods across business use cases: brand positioning, performance reporting, tactical copywriting, campaign dreaming
co-collected-internal-data

Co-collected internal data reveals human context

What: Qualitative brand positioning and perception insights

How: Conducting internal employee interviews and surveys

When: During onboarding audits and key company moments like a rebrand, strategy pivot, or new product launch

Why: To understand the human dynamics behind brand perception. 

Questions to answer: How does external brand positioning match internal perception? Where are the gaps and opportunities to bridge this? What are the underlying organizational norms or cultural biases behind company language?

Whether you've just joined a company or started consulting for one, consider who might be able to offer brand perception insights, outside of your main stakeholders or collaborators.

Employee interviews are an effective way to glean brand insights, but they're also time-intensive. You might not be able to get a 30-minute interview with senior stakeholders across teams, or you might not think to spend time with more junior team members.

Complementary mini-surveys can scale insights and surface trends faster than conducting individual or group interviews. You could also run a survey first, and then use trends from the findings to inform the questions you ask in deep dive interviews.

Try asking employees to describe the company's value proposition in one or two sentences. Pretend they're introducing the organization to a prospect at a conference, without looking at the website for reference.

voice of the employee research

Collect the survey responses in a spreadsheet and note keyword trends. See where it deviates from the language you're hearing from executives. Make a checkbox to mark how many employees mirror executive phrasing, and see what percentage it is. Don't be surprised if it's just 1/4 of the company. That gives you a sense of how far the vision has trickled down, and where the reconciling work is to be done.

For sample size, be strategic. You don't need a huge sample if you're talking to key stakeholders who have influence on decisions and team training. And if you'll be manually analyzing open-ended responses, 15–20 respondents is a good cap to protect your own time while still getting an accurate look at the brand.

self-collected-internal-data

Self-collected internal data reveals historical context

What: Quantitative brand and content performance insights

How: Pulling metrics from tools across the organizational tech stack

When: Onboarding audit, and key reporting moments that inform future strategy (e.g. an end of year review)

Why: See where past actions went right or wrong, so you can double down on the right and avoid the wrong. 

Questions to answer: What strikes you about the data? What validates your intuition or surfaces new insight? How might these findings back your next decisions with confidence?

There's no way around deep data analysis. If you're in-house, dig around. If you're a consultant, ask for metrics reports across platforms. Even if you might not use them, it's better to have more than less. Look everywhere:

  • website traffic and engagement reports (GA4)
  • revenue and leads (Salesforce, sales enablement platforms)
  • email and campaigns (ESPs like Hubspot, Mailchimp)
  • editorial and creative operations (project management tools like Airtable, Notion, Asana)
  • social media (platforms like LinkedIn, Twitter, YouTube)
  • product analytics (tools like Amplitude, Mixpanel)
  • brand tracking and media monitoring (tools like Meltwater, Morning Consult)
  • your notes (anecdotal stories and screenshots collected over time or requested from your clients and client-facing teams)
reporting trendlines

Download all the reports, close Slack, and get dirty with the data. For example, your conclusions and recommendations might look like:

  • It's worth investing in deep subject matter expertise, even in this economy, because last year those packages contributed to up to 30% increase in QOQ revenue.
  • Let's continue to publish quality over quantity, because last year web engagement increased during the quarter that publishing volume decreased.
  • Let's refine our process to identify marketing-ready client partners with sales, since 7 out of 10 of our top performing content pieces were partnerships with strategic accounts.

A tip on how to extract insights from the data, from one of my ex-consulting VPs: "I sit, and I think really hard."

self-collected-external-data

Self-collected external data reveals market context

What: Qualitative market and persona insights

How: Doing desk research, reading industry publications, following thought leaders

When: Always on!

Why: Understand the language of your target audience. 

Questions to answer: What's familiar or foreign to them? Where are the nuances in how they operate? How might you quickly internalize their world and reflect it in the content you publish?

Writing case studies and articles? Website landing page copy? Marketing and sales emails? Check out:

  • Industry reports: Scan McKinsey, Gartner, Forrester (etc.) whitepapers for industry trends and challenges
  • LinkedIn bios and websites of key clients and prospects: Pull Salesforce data or ask for lists of target customers, along with job titles. See what language they use to describe their successes and passions.
  • Press around key clients and prospects: See the potential newsworthy impact your company can enable, so you can channel that charisma and speak to your clients' future successes with concrete examples

If anyone has success stories of using generative AI to expedite this research process, I'd love to hear them.

co-collected-external-data

Co-collected external data inspires weird ideas

What: Hybrid quant/qual cultural insights

How: Engaging with communities, inside and outside your industry

When: Always on!

Why: Enrich your inputs with the unexpected. This quadrant yields award-winning content and puts you on the map of those you aspire to be like. 

Questions to answer: What's the content that no one's searching for — yet? What's the stuff that's hard to scale? What can you learn from communities that see the world in a different light?

My favorite quadrant is the wild child. Go to industry conferences and meetups, speak up in Discords and Slacks, join your local club for your weird hobby. (Or if you're like me, sit at the bar and write poetry.)

At NewtonX, our Head of Brand & Marketing Jackie Cutrone had the idea to do a New York Mag-inspired culture matrix, but for B2B research instead of consumer trends. We brought this to life through the 2023 Insights Matrix, a fun selling tool that showcased our client partnerships and industry expertise.

newtonx insights matrix

For Currant, my food media collective, our editor Sarah Cooke proposed the concept of Climate, Changed: a series on climate change through the lens of jam producers. It became a year-long project that took us in original reporting across six producers across the US.

Creating newness requires a long game approach to ROI. These explorations shouldn’t be measured the same way as top-of-funnel lead generation efforts or bottom-of-funnel conversion tactics. Beyond getting eyeballs to your website or pushing them to purchase, wild card initiatives get users to stay, luxuriate, and wander around. They enable your audience to enjoy your brand, and yield customer loyalty and retention. 

It also requires the right timing. First, build stakeholder trust and organizational credibility so you're insured through uncertainty. Then, ship the weird and watch the waves roll in.

Use the content research framework to channel multifaceted curiosity into content success

There you have it: the map of the content ethnographer's research toolkit, applicable whether you're working in-house for a brand or independently consulting for one.

Remember: you won’t see the whole picture by examining each quadrant alone. Internal data will show you where you're at, but not necessarily where you're aiming to be. External data won't be customized for your business. Individually collected data is limiting; collectively sourced data isn’t scalable.

For the framework to work, you need to be pulling from every quadrant — applying mixed methods to your research and multifaceted curiosity to its synthesis. You'll find the gems of insight by putting in the effort to excavate them and polishing them until they shine.


Interested in more creative strategy insights? Subscribe to my newsletter hyperdisciplinary and The Content Technologist.

Thanks to Arikia Millikan and Deborah Carver for the edits.

May 4, 2023

How to boost creative strategy with visual concepting tools

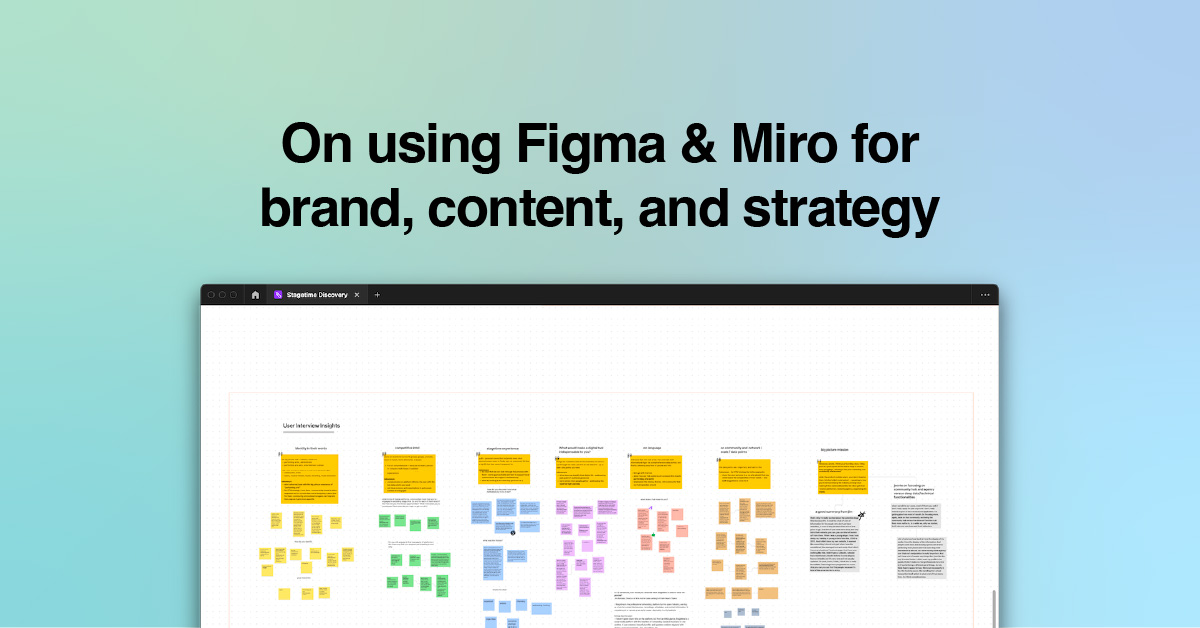
Originally published on The Content Technologist on March 16, 2023, as “Why content strategists should add visual concepting software to their toolkits.” 

ChatGPT and its generative friends may look shiny, but don't forget about the jewels we already have. We've barely scratched the surface of existing content tools designed to enhance our capabilities as content professionals. Want to articulate your audience's needs in new words? Stretch your vision in new ways? Make millions? Algorithms alone won't hit these goals. But there is a suite of tools designed to coax out creativity in the collaborative process, enabling you to be more efficient on the way.

Visual concepting tools like Miro, Figma/Figjam, Mural, and Apple’s Freeform have started to branch into the strategy, brand, and content disciplines over the past decade—and are projected to be a $6B+ market by 2030. They present rich canvases to materialize and communicate vision, a far cry from algorithms that fill content templates with uninspiring words to edit.

While these tools have traditionally saturated the “builder” disciplines like design, web development, and product management, there's much opportunity for "thinker” disciplines—like strategy, marketing, and content—to tap in. These are not only design or collaboration tools, but tools for thinking.

Content requires nonlinear thinking. This takes both strategy and imagination. It pulls from diverse, unrelated concepts and synthesizes them into ideas that bring unique business value. Thus, linear Google Docs won’t cut it when you need to develop content strategy for a website in design conception phase, or show a designer how text should lay on a complex visual. Content strategists need tools that enable us to explore and synthesize nonlinear inputs quickly. We need digital sandboxes where we can get messy with our hands.

As a writer who designs and a designer who writes—for organizations from the Fortune 500 to Michelin restaurant teams, ranging from bootstrapped to venture-backed—I find visual concepting tools indispensable. As these tools have evolved, both in capability and positioning,  their learning curves for mastery have come down, enabling non-designers to add them to their toolkits.

A brief history of visual concepting tools:

  • 2006: Google Docs launches
  • 2011: RealtimeBoard and Mural launch
  • 2015: Figma launches — "as in, figment of your imagination made real"
  • 2019: RealtimeBoard rebrands as Miro — "Derived from Joan Miró, the Spanish painter and sculptor who painted bright, bold murals of surreal amoebic forms. His vibrant, energetic work was a perfect metaphor for bringing ideas to life."
  • 2020: Covid-19 launches, eliminating scenarios where teams gather around real-life whiteboards with real-life stickies
  • 2021: Figma launches Figjam, an online collaborative whiteboard on top of their existing interface design tool
  • 2022: Mural rebrands as a collaborative intelligence company and acquires LUMA Institute to offer training in design thinking and collaborative problem solving
  • 2022: Apple launches visual collaboration app FreeForm with its most recent OS, and our only choice is to accept
Joan Miró, The Tilled Field, (1923–1924), Solomon R. Guggenheim Museum

Both Miro's concept of "bringing ideas to life" and Mural's initiative toward "collaborative intelligence" speak to more than facilitating design and visual communication. These visual whiteboarding companies are signaling they're in the business of strategy. And strategy-plus-design is a much bigger market than just design. 

Because "what vision does is find concepts,” says Mary Potter, an MIT professor of brain and cognitive sciences. “That’s what the brain is doing all day long—trying to understand what we’re looking at.” Given how quickly executives need to digest information to make business-critical decisions, communication methods must evolve to keep up. We’re no longer tied to wordy memos or linear slide decks. We now have more fluid tools that can depict the flow of nonlinear strategy, instantly.

Not every campaign needs a brainstorm of digital Post-It notes, but can you think of at least one this quarter? How might you use the possibilities of the tool to concept more interesting projects? Tell more compelling stories to validate your creative pitches? If all your ideas are straightforward enough that they never outgrow the form they're seeded in (like a doc), then maybe that's a sign to try something new.

Today you’ll learn how to use visual concepting tools across five different strategic use cases:

  • Copy and design collaboration
  • Strategy and design collaboration
  • User research and data analysis
  • Creative brainstorming
  • Anything low stakes that you can test!

Or at least you'll try, and maybe fail, but at least you’ll learn how they work best for your needs — whether you're in-house or independently consulting, for B2B or B2C.

1. Copy and design collaboration

Copywriters typically work in docs and designers work in design software. But what of the crossover? How might visually inclined copywriters or copy-inclined designers take the extra step to help each other out?

Mockup (left) and final design (right) of the 2023 Insights Matrix we published at NewtonX (Series B B2B research company), inspired by NYMag's Approval Matrix. (Team: Jackie Cutrone on strategy, Clare Lagomarsino on design, me on copy and strategy)

Do you have visual ideas that you struggle to articulate clearly? What about an ambitious campaign idea where copy depends on visual placement and vice versa? A picture tells a thousand words. Visualize your briefs to smooth out collaboration between copy and design and minimize room for misinterpretation.

In the case pictured, writing directly into Figjam meant I could edit and rearrange as I pleased, in concert with the final design placement. This yielded zero design revisions — even more elusive than inbox zero.

2. Strategy & design collaboration

A landing page brainstorm conducted with design, production, growth marketing teams, and brand marketing stakeholders. (Team: Clare Lagomarsino on design, Jackson Bell on production, Ryan Toner on growth, me on content strategy)

While brainstorming landing pages that check SEO and brand boxes, filling a digital canvas with full-page screenshots of inspiration saves time during meetings and prevents the chaos of switching sites while screen sharing. It also enables each collaborator to add their commentary aligned with the aspects of designs that stand out to them.

In the illustrated example, the design team’s pushing visuals and interactivity, the growth team’s speaking to search engine authority and leads, production’s grounding us in what's feasible within a set timeline, and brand’s weaving it all together. Impactful creative happens when domain experts collide in the same room.

3. User research and data analysis

Developing brand positioning insights for Stagetime, a seed stage market network for the performing arts industry. This was the preliminary draft of user interview takeaways passed to the founder. (Team: Jennie Moser as founder/client, me as strategy consultant)

Good strategy requires good data. Desk research, or internal data, or intuition are not enough; ideally, a data toolkit also includes primary research. Visual tools can support data points and conclusions without reading like a college thesis. You’re not necessarily collaborating with a team to pull takeaways from customer interviews, but you can use a whiteboarding tool  to quickly analyze stream-of-consciousness style thoughts.

Say you're at an early stage company and you're tasked to conduct a few customer/user interviews for insights to inform strategy. But you're not a research professional and you don't have specialized tools to draw from. On the upside, you're likely not working with a ton of interviews — maybe you've managed to get one interview with each key persona. But it takes work to comb through transcripts! When you’re trying to manually quantify qualitative insights, scanning and highlighting in infinite-google-doc-scroll quickly becomes a slog. 

I find it more effective to parse out themes in Figjam, and then share them back with stakeholders, whether through Figjam or transferred to a slide deck.

It also doesn't need to be pretty. Above's an example for NewtonX, where I was pressed for time. I pasted transcripts into the Figjam (thanks to my a sick love of verbal anarchy), copied important quotes into stickies, grouped them into themes (e.g. brand perception, user feedback, user dreams), and then pulled bullet points from the themes. Those points fed into the slide deck I presented to internal stakeholders.

4. Creative brainstorming and landscape mapping

Caption: A snapshot from a campaign strategy project, mapping out the cultural landscape for a Fortune 500 retailer with Another, a creative agency in LA. (Team: Micah Heykoop as director and lead, me on strategy)

Sometimes it’s helpful to map out the cultural landscape to unlock insight into the whitespace your company can enter. You can also apply it to competitive analyses: what's going on in the market, how can we get an aggregated look at it, and where can we do something new?

No need to go for a hyper-comprehensive look—the goal is to capture just enough to jolt the brain into action and get the pinballs shooting around. Literally map out what competitors are saying so your company can unlock the key need that they’re not saying.

Above is an example of a brand jam with Editor Sarah Cooke when we were reenvisioning Currant, my food media collective featured by Mailchimp/Intuit, Harvard's Nieman Journalism Lab, and Creative Mornings.

The top half contains rapid fire brainstorming around core questions to draw out:

  • Why do we exist?
  • What’s our truth?
  • How do we tell our truth?
  • Who do we speak our truth to?
  • What does success look like?
  • What are the challenges ahead?

Bottom half is the GV sprint, which we realized wasn't the right framework, but at least gave us conversation starters.

Brainstorming is probably one of the most intuitive use cases for digital whiteboarding tools, but there's still value in it. It's helpful to shake out everything from senior leadership’s heads and have something to point back to for alignment when you get to strategy development.

5. Anything low stakes that you can test!

Above is an industry messaging brainstorm I tried for NewtonX with my product marketing teammate Jenny. (Another pro tip: find kindred spirits who champion visual tools!)

We were aiming to compile keywords and trends across our core industries and personas, to inform product marketing and thought leadership content. But we found that we needed something more efficient to hit deadlines, and docs were better suited to quickly edit the sheer volume of words involved.

It's great to try Figjam and have it not work! That means you're successfully testing the bounds for your needs.

Use visual thinking tools for strategy success

Visual collaboration tools introduce play and exploration into process, resulting in more confident pitches and higher performing strategy.

As a designer, I find more freedom in Figjam than a slide deck, but my intent here is not to prescribe tools. You could frame Google slides like a Miro canvas; the execution is more about the mindset of play. It's up to you to evaluate the exploration vs efficiency tradeoff per project. Once you nail the balance for you and your team, it yields a three-part impact to ROI:

  • Enrich your collaboration and ideation, resulting in higher impact projects
  • Make your own process more efficient, yielding time savings
  • Communicate more effectively to stakeholders, thus elevating your role

Though I think the greatest ROI is: whiteboarding tools help us get creative again. With a blank canvas, virtual stickies, and a malleable moodboard, we can return to why we got into the business in the first place.


Interested in more creative strategy insights? Subscribe to my newsletter hyperdisciplinary and The Content Technologist.

Thanks to Arikia Millikan and Deborah Carver for the edits.